Many individuals especially those nearing and in retirement are facing this question. An article I have linked here offers a deep dive into Fidelity’s viewpoint on inflation expectations. Here’s an article from Vanguard that is extremely insightful. Here’s my assessment below:
While inflation is a concern that should not be taken lightly, the main concern people really have is will their money keep up with inflation, plus some?
As wages, goods, corporate taxes, and other inflationary costs increase, the price is passed somewhat onto the consumer.
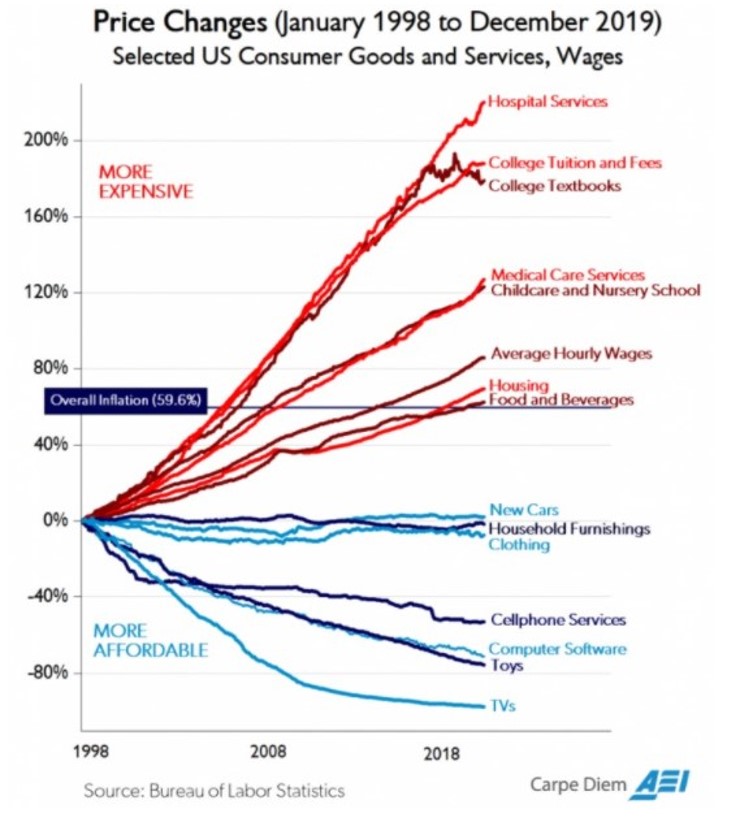
Here’s a chart showing the various inflationary costs per sector from 1998. (click into it to enlarge)

Note: Not all inflation is equal. The advancement in technology has caused some industries to experience deflation and pricing pressure over the last decade.
During the 1980s, however, inflation averaged at 6% per year. Even with higher inflation, U.S. stocks managed to earn 12% per year, after inflation.
While 6% inflation seems high to many, given today’s current outlook, eventually, being prepared for the unexpected, such as high inflation in certain sectors, will pay off. It’s equivalent to taking the life of a Knight to set up a “checkmate” with the Queen in a game of Chess. With a properly constructed portfolio, inflation does not have to be that bad for your portfolio growth over the next decade.
Stocks have done better than bonds during inflation. Granted, periods of lower inflation have been better for stocks than periods of higher inflation, however, when looking at historical returns, we see that stocks do not always suffer during periods of inflation. This makes sense as businesses often times can pass costs onto the consumers.
See the table below for REAL stock returns (after inflation) during the 1980s, a period where inflation averaged 6% per year for the decade. All in all, it was a great decade for stocks, earning 12% real returns per year (after inflation).
U.S. STOCKS 1980-1989
| Nominal Return | Inflation | REAL Return | |
| 1980 | 32.76% | -14.77% | 17.99% |
| 1981 | -5.33% | -7.75% | -13.08% |
| 1982 | 21.22% | -4.47% | 16.75% |
| 1983 | 23.13% | -4.5% | 18.63% |
| 1984 | 5.96% | -4.03% | 1.93% |
| 1985 | 32.24% | -4.84% | 27.40% |
| 1986 | 19.06% | -1.29% | 17.77% |
| 1987 | 5.69% | -4.49% | 1.20% |
| 1988 | 16.64% | -4.94% | 11.70% |
| 1989 | 32.00% | -5.86% | 26.14% |
Here is the 1940s table for U.S. stock returns. Inflation averaged 5% per year over this decade, and after inflation, stocks still earned a real return of 5% per year over the decade.
U.S. STOCKS 1940-1949
| Nominal Return | Inflation | REAL Return | |
| 1940 | -8.91% | -0.65% | -9.56% |
| 1941 | -9.09% | -8.21% | -17.3% |
| 1942 | 21.74% | -10.08% | 11.66% |
| 1943 | 23.6% | -3.55% | 20.05% |
| 1944 | 19.67% | -2.69% | 16.98% |
| 1945 | 39.35% | -3.06% | 36.29% |
| 1946 | -12.05% | -13.5% | -25.55% |
| 1947 | 2.56% | -8.33% | -5.77% |
| 1948 | 9.51% | -3.18% | 6.33% |
| 1949 | 15.96% | 2.46% | 18.42% |
Check out 1942 specifically. Inflation cut stock returns in half, however, U.S. stocks still earned 11.66% after inflation that year. And all in all, stocks fared well over a period that inflation was high.
While we acknowledge inflation is a concern, we are not too concerned given the current economic backdrop. Remember, over the long-term, regularly investing and staying the course is what works.
We carefully consider each of our client’s goals and risk tolerance and always have inflation or market-risk in mind when constructing portfolios. While holding a lot in “cash” may feel good, contrary to feeling good temporarily, it has historically offered the lowest returns. Therefore, without taking too much risk, maintaining a diversified portfolio of stocks, bonds, cash, real estate, etc. should help reduce the risks and worries of inflation over the near term.
Feel free to call with any questions about inflation expectations going forward. Set up a time to talk today! Matt.Ward@newcenturyinvestments.com
Matt Ward, CFP®


